Multimodal and multicolour microscopy to identify biomolecules in large-scale electron microscopy
- Abstract number
- 37
- Presentation Form
- Oral
- DOI
- 10.22443/rms.elmi2021.37
- Corresponding Email
- [email protected]
- Session
- Correlative Microscopy Across the Scales
- Authors
- Pascal de Boer (1), Aditi Srinivasa Raja (2), Jacop P. Hoogenboom (2), Ben N.G. Giepmans (1)
- Affiliations
-
1. Department of Biomedical Sciences of Cells and Systems, University Medical Center Groningen, The Netherlands
2. Deptartment of Imaging Physics, Delft University of Technology, The Netherlands
- Keywords
Large scale electron microscopy
colorEM
CLEM
Fluorescent Proteins
- Abstract text
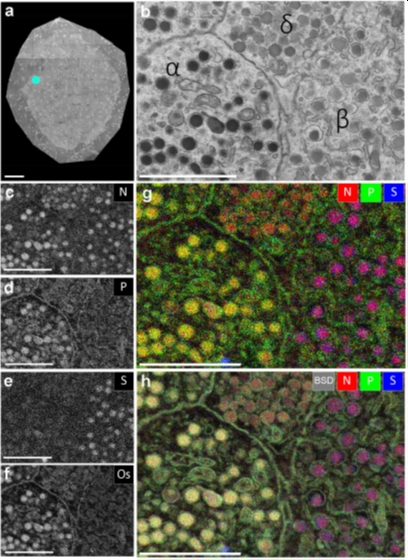
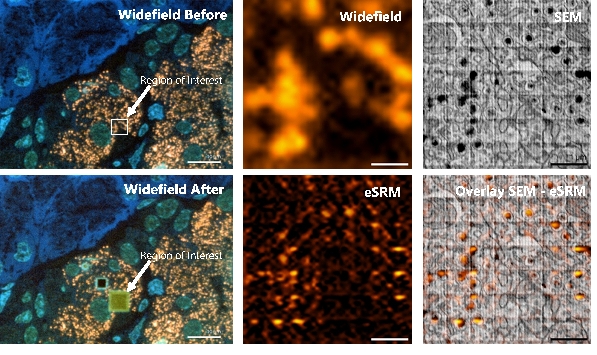
Electron microscopy (EM) is a powerful tool for imaging biomolecules at near-molecular resolution in cells and tissue, which is essential to understand the regulation of life and disease. However, restricted fields of view (FOVs) at high resolution hamper the quantitative power of EM. We routinely perform large-scale 2D EM on complete cells and tissue sections to maintain both large FOVs and high resolution, called nanotomy for nano-anatomy (www.nanotomy.org). Multiple disease and tissue specific databases are being created as a resource for biomedical EM data for researchers worldwide. This includes our recently published repository for the study of type 1 diabetes containing zoomable datasets of pancreatic tissue from over fifty donors [1]. However, identifying specific molecules in such large grey-scaled datasets is troublesome. Therefore we optimized and routinely apply energy dispersive X-ray analysis (EDX) for nanometer resolution elemental fingerprinting on bio-samples [2,3]. EDX-based ‘colorEM’ allows identification of elemental enriched probes as well as endogenously present elements (figure 1). Furthermore, with correlated light and electron microscopy (CLEM) multimodal fluorescent and EM labels show specific biomolecules in a high resolution context [4]. Though, targeting, spectral variety, and registration are often limited. Therefore, to better identify proteins of interest, we now develop a super-resolution fluorescence technique for integrated CLEM called electron beam-induced super resolution microscopy (eSRM): fluorescence signals are recorded during scanning of the focused electron beam, local modifications of the signal by the electron beam allow localization of fluorescence molecules with improved resolution (figure 2). However, novel probes are required since fluorescence of current available probes fade away in the EM vacuum during integrated CLEM, or quench upon EM sample preparation. Therefore, fluorescent proteins were optimized for high fluorescence yield in vacuum, either stability or lability under electron irradiation, and compatibility with EM sample preparation. This resulted in several candidate probes with both high vacuum quantum yield and fluorescence retention in EM samples. Thus, the quantitative power of EM is improved by nanotomy in combination with analytical EM and optimized CLEM methods.
Figure 1. EDX defines cell-types and subcellular structures in nanotomy maps. (a) nanotomy overview of a rat islet of Langerhans. (b) Area of interest (indicated in a; cyan dot) shows four cells with different granules based on grey levels and morphology. (c-f) Elemental content in the ROI for nitrogen (N), phosphorus (P), sulfur (S), and osmium (Os). (g) Overlay of N (red), P (green), and S (blue) allows identification of cells and granules. (h) Overlay of back scatter ICD image (BSD, grey) over the color-image of g. Bars: 50 µm (a) and 2 µm (b-h). This figure is adapted from [2].
Figure 2. Electron beam-induced super resolution microscopy (eSRM). (a) Post-embedding immunolabeling of insulin on an ultrathin rat pancreas section using alexa fluor 594 (orange), with the region of interest (ROI) depicted. (b) Widefield fluorescence image of ROI. (c) SEM image of the ultrastructure of the ROI revealing single insulin granules (black cores). (d) Image after the eSRM protocol, showing the bleached ROI. (e) The same ROI as in b after the eSRM protocol. (f) The eSRM image from e overlaid on the SEM image of c. Bars: 10 µm (a, d) and 1 µm (b-c, e-f).
- References
[1] de Boer et al., Nature Communications, 11, 2475-020-16287-5, 2020
[2] Scotuzzi et al., Scientific Reports, 7,7:45970, 2017
[3] Pirozzi et al., Histochemistry and Cell Biology, 150(5):509-520, 2018
[4] de Boer et al., Nature Methods, 12(6):503-13, 2015


